Research Directions:

|
|
|
Introduction to Magnetic Domains Modern magnetic devices (GMR read heads, magnetic sensors, hard disks and spintronics devices) relies on storing or manipulating magnetic information in smaller length scales (nms) at faster time scales (nanoseconds to femto seconds). It is very important to know the magnetic structure in order to understand the magnetic device. For example, we want to know how a magnetic device behaves in presence of magnetic field or what if we put two magnetic elements in close proximity, how does the magneto-resistance (GMR effect) behavior changes in different nano-element. All these questions are related to the magnetic structure of the sample or device. There are different energies acting in a magnetic system these are due to exchange anisotropy, shape anisotropy, magneto-crystalline anisotropy, magneto-striction, self-energy of the system. As a result of the competition between the different energies magnetic system breaks into regions of constant magnetization called magnetic domains separated by domain walls where magnetization change from one direction to the other. Magnetic domains are important part of the magnetic system and one need to understand how these domain forms and how can we see them with better spatial and temporal resolution. Advancement of nano-science allows us to prepare structure in nanometer scale both by self-assembly and electron beam lithography. When physical dimension of the system becomes comparable to length scale of the system then one starts to see new phenomena. For an example, magnetic particles or lithographically patterned thin film elements that are smaller than a domain wall width might be expected to be in a single domain state. There are many different imaging techniques one can use to see these domains and study their dynamics.
In an ideal case magnetic imaging technique should provide the following:
No single, current imaging technique can satisfy all of these demands. In order to get a more complete picture of the magnetic structure, therefore, multiple complementary imaging methods should be used. In our current research we are studying magnetic domains using Magnetic Force Microscopy (MFM), Photo electron emission microscopy (PEEM) utilizing X-ray Magnetic Circular Dichroism (XMCD) and Coherent Resonant Magnetic Scattering. [top]Further Reading:
(Books)
1. Magnetic Domains: The Analysis of Magnetic Microstructures by Alex Hubert and Rudolf Schafer
2. Modern
techniques for characterizing magnetic materials, edited by Yimei Zhu 3. Magnetic Imaging and
Its Applications to Materials Edited by Marc De Graef and Yimei Zhu 4. Magnetic Microscopy of Nanostructures Edited
by H. Hopster H.P. Oepen 5. Magnetism From Fundamentals to Nanoscale Dynamics by J.
Stoehr and H.C. Siegman A typical image recorded with a MFM contains information about both the topography and the magnetic properties of a surface. Which effect dominates in the image depends upon the distance of the tip from the surface, because the magnetic force persists for greater tip-to-sample separations (far-field regime) than the van der Waals force. If the tip is close to the surface (near-field regime), where standard NC-AFM is operated, the image will be predominantly show topographic features. Key to understand MFM is to identify the force or force gradient term that is dominant in a given tip-to-sample distance regime. MnAs films grown on GaAs (001) show a periodic array of stripes (stretched along the a-axis direction) of ferromagnetic a-phase and paramagnetic b-phase in an alternating arrangement. MnAs exhibits a first-order phase transition from the hexagonal, ferromagnetic a-phase to the orthorhombic, paramagnetic b-phase at around 40oC. In epitaxial MnAs films on GaAs, it is known that the ferromagnetic and the paramagnetic phases coexist over a wide temperature range of about 30oC below the phase transition temperature. In this temperature range, MnAs films on GaAs (001) and (311)A substrates show a regular array of ferromagnetic stripes due to the involved strain. Figure shows the topographic contrast measured by AFM [top left]. The corresponding MFM image of the same scan area [bottom left] shows magnetic contrast on the ferromagnetic stripes that appear as ridges in the topographic image. The right bottom of the figure shows the zoom in part of the MFM scan. A number of different domain structures are visible on the ferromagnetic stripes. In order to understand the typical MFM contrast for simple domain structures, we consider bar magnet-like domains. Top right of the figure shows sketches to explain the contrast mechanism resulting from the interaction of the tip magnetization with the stray field of the domains. The ferromagnetic stripe is assumed to be divided into oppositely oriented bar magnets along the total width of the ferromagnetic stripe. This assumption is justified as this material has one easy magnetization direction along the width of the stripe. The magnetic stray field of the bar magnet-like domains will either point up (out-of the plane) or point down (back into the plane) at the end of the ferromagnetic stripe, as shown by arrows in the top right sketch in the figure. The MFM is sensitive to these out-of-plane components which interact with the tip magnetization. The interaction between the tip and the stray field of the sample depends on the relative orientation of these two vectors. The parallel (antiparallel) orientation of the two magnetization vectors results in an attractive (repulsive) interaction, giving a bright (dark) contrast. [top] Figure shows 500 nm thick MnAs film on GaAs (001) imaged with LEEM and XMCDPEEM showing the topography and magnetic contrast, respectively. The magnified domain pattern on the right shows the two antiparallel magnetization directions in a-MnAs giving rise to black and white contrast. The arrows and the wavy line indicate the direction of the magnetization axes and photon wave vector (along the magnetic easy axis [a-axis] direction of MnAs). For XMCDPEEM imaging, the secondary electrons resulting from the photo-ionization of the Mn L3 level with a photon energy of 639.5 eV are used. The LEEM image is obtained with 4.5 eV electrons. Depending on the relative orientation of the sample magnetization and photon wave vector either black or white contrast can be seen, which is shown in the magnified domain pattern in the figure. The gray contrast is due to the paramagnetic b-MnAs. The topographic LEEM contrast is a result of the height difference between the stripes of different MnAs phase composition. We have obtained interesting results which when compared to MFM measurements indicates the presence of in-depth domain in these films. Related Publications: Jyoti Mohanty et.al, Appl.
Phys. Lett. 82, 2308-2310 (2003), Appl.
Phys. A 77, 739-742 (2003), Appl.
Phys. Lett. 83, 2829-2831 (2003), Appl.
Phys. Lett. 83, 2850-2852 (2003). Appl.
Phys. Lett. 84, 1132 (2004). Physica
E 24, 115 (2004). J.
Appl. Phys. 96, 5056 (2004). Appl.
Phys. A 81, 1359 (2005). J.
Appl. Phys. 98, 013907 (2005). J.
Vac. Sci. Technol. B 23, 1759 (2005).
J.
Appl. Phys. 98, 063909 (2005). Phys.
Rev. B. 73, 104441 (2006). J.
Magn. Magn. Mater. 305, 457 (2006).Appl.
Phys. A 84, 231 (2006). Fe/Gd multilayers and higher periodicity of Fe/Gd layer] were grown at room temperature by sputtering Fe and Gd onto a 100nm thick Si3N4 membrane. Standard magnetic hysteresis measurements [magneto-optic Kerr effect (MOKE) and vibrating sample magnetometer (VSM)] show perpendicular anisotropy (see Fig. 1). From these measurements the anti-ferromagnetic coupling between Fe and Gd is evident. The magnetization in these systems breaks up in domains (width of about 250nm) of different directions in order to reduce the stray field energy. The formation of these domains coincides with the creation of domain walls where the magnetization rotates from one direction to the other at the expense of the exchange and anisotropy energies. Magnetic force microscopy (MFM) images show clear maze-like domain structure as a result of strong perpendicular anisotropy. MFM is sensitive to out-of-plane magnetization as the magnetic tip used for measuring the magnetic stray field of the sample is always magnetized along the tip axis and hence sensitive to the out-of-plane component of the magnetization. The dark and bright contrasts in the MFM images are due to magnetization of the sample pointing out-of-plane and into-the-plane, respectively. At each ramification of a domain the three branches are oriented at angles of about 120o relative to each other. This behavior can be traced back to repulsive dipolar force among the equally magnetized domains. [top] Why use X-rays? X-ray scattering is non-invasive as far as domain mapping is concerned. Element sensitivity and depth resolution are the key advantages of x-rays to study magnetic materials. To study the dynamics two most tuning parameter, temperature and magnetic field can easily be added to existing set-up with nominal modification. By contrast, MFM is an invasive technique in which one may influence the magnetic domains of the sample by the stray field of the tip or vice versa. Imaging in the presence of moderate magnetic field (above 200 Gauss) is difficult as it changes the magnetization of the tip. Moreover, one observes an after-effect in response to the tip magnetization or the external field. Using resonant magnetic x-ray scattering we can probe fluctuations in the domains and their dynamics. Spin-orbit splitting at the L and M absorption edges affords direct access to the domain magnetization vector. Different type of domains may result depending on the magnetic history of the sample. Application of magnetic field in the perpendicular direction results in randomly oriented "maze" domains, whereas in-plane field creates stripes preferentially oriented along the field direction. Increasing magnetic field results in change of the stripe structure to bubbles and then saturated at higher field value. At saturation, film transfer to single domain state. MFM shows only bright or dark contrast depending on whether one measure at the positive or negative saturation field following the hysteresis loop. Formation, shape and stability of perpendicularly magnetized domains can be explained by the competition of the short range exchange interaction and the long range magnetostatic interaction. At higher magnetic fields a lattice of bubble domains has lower energy than stripe domains. Thus, a critical external field exists, where stripe domains become instable and collapse into bubble domains. It will be interesting to see the evolution of the domain pattern as a function of temperature. As the saturation magnetization goes down one can predict that at higher temperature the magnetization goes in-plane which would result in weak magnetic contrast. Recently, we obtained strong resonant magnetic speckles in a multilayer GdFe system at the Gd M5 edge at the 2-ID-B beamline at APS. Substantial reduction of magnetic contrast was observed by measuring away from the resonance peak. Figure 4 show speckle patterns taken at Gd M5 (1189 eV), M4 (1218 eV) as well at 1179 eV (off the resonant edges). Use of resonant coherent x-rays will enable us to gain information about the local disorder on the nano-scale. By analyzing correlations between speckles as a function of q, we can understand spatial distribution of correlations responsible for memory effects as a function of magnetic field and temperature, and identify the role the disorder plays in formation and stability of magnetic domains. Measurement of the speckle as a function of time will enable investigation of the effects of temperature and magnetic-field on domain wall fluctuations. The timescale of the fluctuations generally increases with the wave vector q (directly related to spatial frequencies or length scales for which fluctuations are observed). Analysis involving higher-order intensity correlation functions can yield information on the intermittent dynamics of magnetic switching (as opposed to continuous uniform domain wall propagation), while two-time correlation functions can be used to investigate non-equilibrium (aging) behavior of the system induced by a rapid change in tuning parameter, either the magnetic field or temperature. In future, using x-ray lensless imaging coupled with scanning `methods to study extended samples we can access not only the order-parameter (out-of-plane magnetization), but also the phase, which may provide crucial "hidden" information that is not accessible with STXM, PEEM, MFM or other techniques. 
References: Jyoti Mohanty, Ashish Tripathi, Erik Shipton, Keith Chan, SangSoo Kim, Ian McNulty, Eric Fullerton and Oleg Shpyrko, APS March Meeting, Pittsburg, March 16-20, 2009. View Abstract |
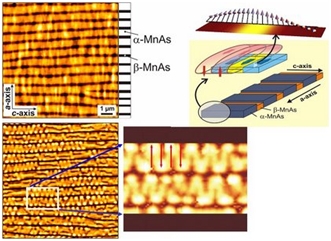 Magnetic Force Microscopy (MFM) images of magnetic domains in MnAs on GaAs
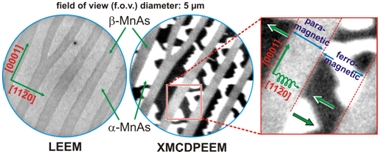 Low Energy Electron Microscopy (LEEM) and X-ray Magnetic Circular Dichroism (XMCD) and photoemission electron microscopy (PEEM) of MnAs on GaAs.
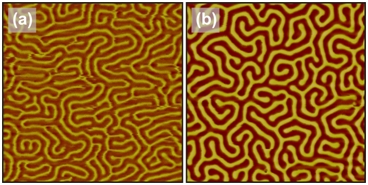 MFM images of magnetic "maze" domain patterns in GdFe multilayer films
